Perfect training means understanding your needs
When a customer asks for an optimized training we always want to know what his/her goals are and if there is a certain race or competition he/she is aiming for. We then analyze this event in detail and develop a specific profile with all its important demands. The following example is one of those analysis, examining the specific efforts of a Fixed Gear Crit.
Analysis of a case study from the 8bar Fixed Gear Crit
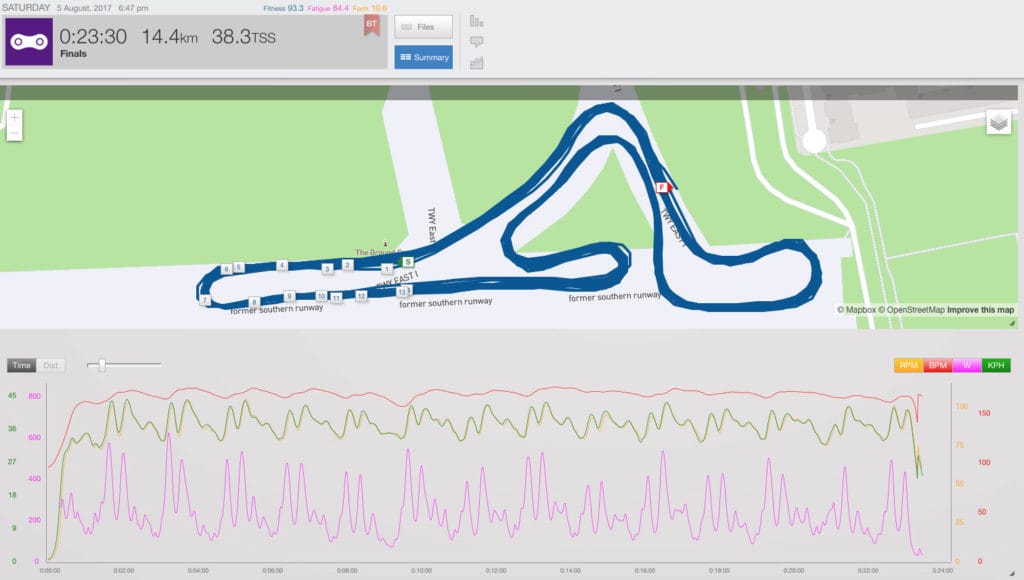
This past weekend, the 8bar Fixed Gear Crit happened in Berlin. It’s a race especially for track bikes, which means only one single fixed gear, no shifting, no brakes. This year, the race consisted of 30 laps with 1k length each. Many narrow turns as well as two long straights promised a very spectacular and thrilling, but also very strenuous race.
In our case study, the race was aborted after 14/30 laps before the leading group overlapped. So in the analysis we are looking at a 14,4 k distance with an average speed of 37 kph and average power of 280 Watts (Normalized Power). The reason for getting overlapped early in the race and the certain demands, which obviously couldn’t be met in this case are now presented in detail.
The first cut is the deepest
The starting position in a crit race is often very crucial. Right with the starting signal, the head of the field takes off and accelerates immediately. The pace is very high from the beginning because they have a clear track ahead and can ride the perfect line. In the back of the field its hard to follow because you have to deal with all the other competitors around you.
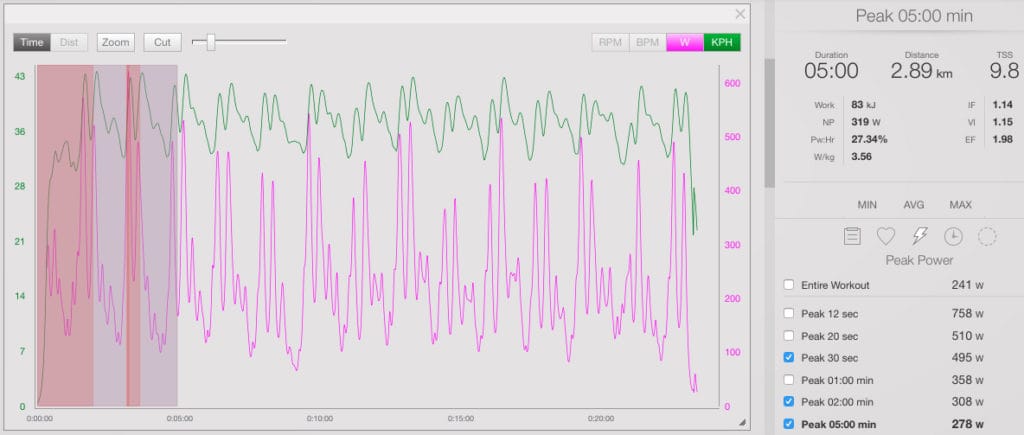
Taking a closer look at the presented data, it’s clearly to see that the race started right away with a maximum effort. All peak power values (peak 5 seconds, 30 seconds, 2 minutes and 5 minutes) were reached in the starting phase of the race (see picture 2). On one hand this was of course due to the freshness at the beginning of the race. But it was also a result of an above-average effort in order to move up in the field. On every straight, the rider needed to pass other competitors and close opening gaps. So it’s no surprise that also the peak velocities of the whole race were reached within the first two laps.
This high-intensive effort lead to quickly developing fatigue. After 5 laps, the power dropped dramatically and the next gap could not be closed.
First conclusion: Always start in the front 😉
If you fail to do so, you should be ready to go all out for a couple of minutes right from the start. In this case study the tolerance in the “red zone” lasted for 5 minutes (this time point is individually different and highly trainable) before the power output dropped. This means you should exactly train this with 3-5 minute power intervals giving everything you can before going into a resting phase.
Ups and Downs
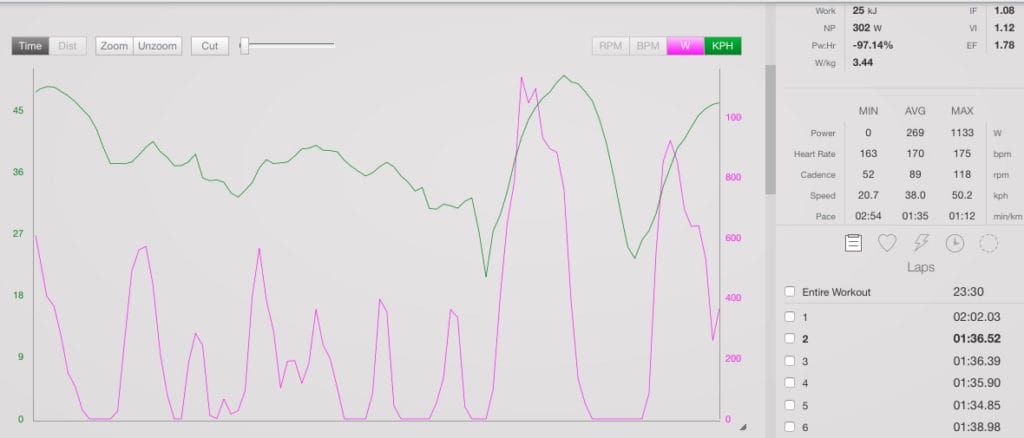
But what was the reason for the drop after the fifth lap and where exactly did the exhaustion come from? To answer this, we have to take a closer look at a single lap power data (Picture 3). Each lap showed the same pattern of stressors and we were able to detect to different phases.
Phase 1
In the first phase (60 sec) consisted of the curvy part of the course. The velocity was almost constant (with a tendency to slow down) but the power curve was fluctuating with 6 minor waves around an average of 180 W.
Looking at the average of 180 W, this part didn’t seem to be too hard. Nevertheless, in our recent blog article we showed that it makes a huge difference how this average power is achieved. 60 seconds riding at a constant power output of 180 W might be easy, but this changes dramatically when the same average power is formed intermittently. In the race, every turn had to be pushed through with a couple of hard pedal turns. This resulted in short, repeated, highly intense efforts of 400-500 W followed by passive sections (0 W). This wave-formed power output induced a high stress from the very beginning, which was also reflected by the heart rate. Within the first seconds of the race, the heart rate raised to over 165 bpm (for comparison an expected heart rate at constant 180 W would be 130 bpm).
Phase 2
In the second section of the course, the riders went on the two straights. This meant accelerating to maximum velocities (over 50 kph), taking one last sharp hairpin turn and pushing once more as hard as possible to the finish line (peak power over 1100 W). Even though this effort lasted for only 5-10 seconds, the maximum forces applied out of every turn were very strenuous. Every muscle cell has to release its full energetic capacity within seconds leading to a high cellular stress.

Second conclusion: Race-specific intensities!
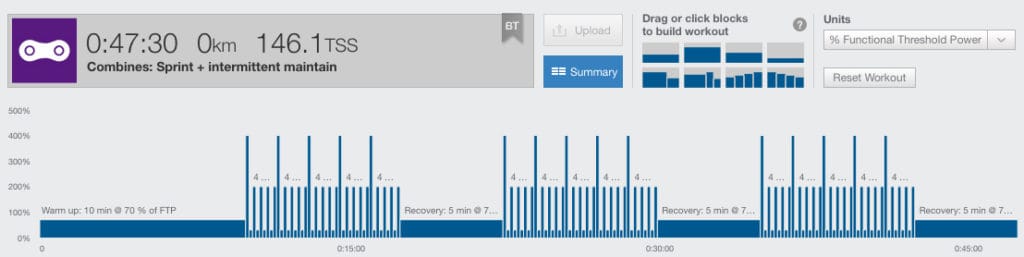
Do not always train constant loads or steady state efforts. Instead, it’s important to train repetitions of very short but hard pedal movements followed by more passive recovery phases. Most races don’t take part at certain threshold levels. The distribution of power is often more to find in either a very high or very low power output (see Picture 4).
In our coaching at Diagnose Berlin, we first develop certain isolated skills with our customers before combining them to more complex training sessions. See Picture 5 for an example of a training in a later state.
Technique and tactics can make the difference
Beneath all the numbers and facts (which we examine with our personalized performance diagnostics) there is also one important factor that’s very crucial but yet harder to measure objectively. It’s race-specific technique and tactics.
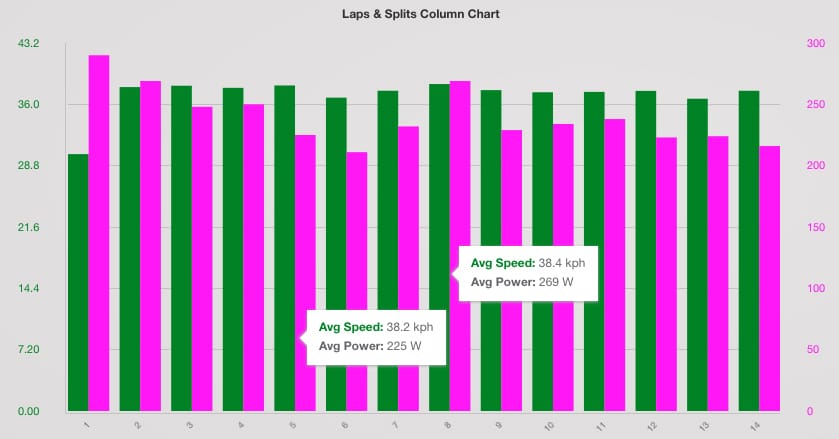
If we take a closer look at each data set from lap to lap, we can make the influence of these factors pretty obvious (see Picture 6). While the average lap velocity (green) stayed at an almost constant level, the average lap power output fluctuated dramatically. Let’s compare lap 5 and lap 8 for a better understanding. Both laps were ridden with nearly the same speed (38.2 and 38.4 kph). In lap 5 though, this velocity was achieved with a power output of only 225 W while in lap 8 it was 269 W. This was mainly due to a better position in the field, thus resulting in a better line through the turns and conserving more energy in the slipstream.
Third conclusion: Don’t forget your technique!
Even when your physical abilities are strongly or poorly developed, your technique can make a huge difference. This example shows once more, that is highly necessary to practice race-specific skills. This part should at least get the same amount of attention in your training routine as isolated physical endurance training.
This article showed that training is highly specific and needs to fit the certain demands of a particular event/race. If you want an analysis of your race or competition just contact us. We have been involved in many different sports and have the expertise and know-how to analyze your discipline and optimize your training.
Here’s the link to the complete data analysis on TrainingPeaks: http://tpks.ws/LLrG6